Think proportionally about Place Value
It is never too late or the wrong time to think proportionally about Place Value
As you know at the beginning of every new school year I suggest to teachers that they do a quick and easy-to-manage activity that allows them to find out where their students are at with place value so that they can plan accordingly. There is so much maths hinging on place value concepts.
This year’s activity is:
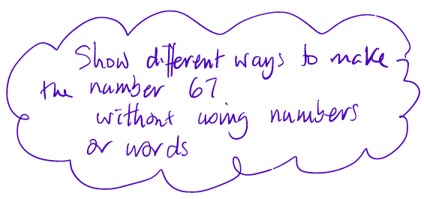
This activity is almost identical to last year’s question about 123. Don’t ask me why I chose 67 this time, perhaps because it’s odd, prime, close to 70 or just a random number. In any event it will provide opportunities to see work samples such as the following.
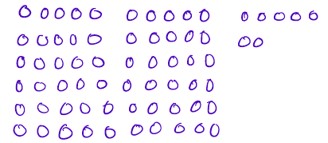
Work Sample 1 – not yet actually counting to 67 with stable order and one to one correspondence.
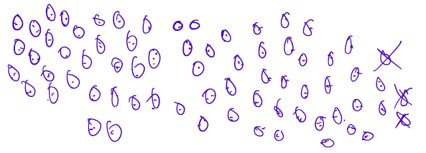
In this work sample, notice the dots used to keep track and how many times the circles were recounted. Also, notice the fix up strategy.
Work Sample 2 – unitizing emergent.
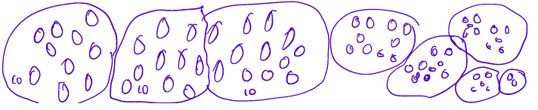
Here, notice how random groups have been looped in 10s and how the student draws, counts and then realizes they need to make them easier to count.
Work Sample 3 – using tallies.
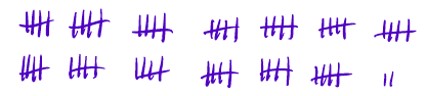
Notice how tallies like this may lead to flexible counting strategies 5s, 10s or even 20s can spotted in the arrangement of tallies.
Work Sample 4 – organizes a system of 10s to make counting easier.
Notice how the row of 10 was quickly constructed in 2 groups of 5 and how all the other rows were replicas of the 10s. No need for counting at all. The 6 rows of 10 can be clearly spotted and counted in 10s or a multiplication carried out.
Work Sample 5 – sticks with the task, creating more than one arrangement and becoming more flexible and ‘playful’ as they do so.

Note: These ideas are expanded upon in our new Early Place Value resources. The Place Value mat could well be used for this activity.
Using the activity with Teachers
Anyway, I have used this activity with teachers twice already this year and here are my observations so far. Some teachers:
- were able to second guess what they might see from their students, expecting even some grades, 5, 6, 7 students to use inefficient counting strategies and not trust the count,
- presented rigidly in 10s and 1s, not wanting to use a different representation when prompted,
- drew organized diagrams to make it easy to see how many altogether,
- drew diagrams that were not proportional, did not display the magnitude or multiplicative nature of place value, but wanted to defend their ‘non-proportional’ diagrams,
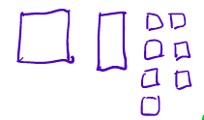
Notice the lack scale in this diagram. It is supposed to show 50 + 10 + 7. Many teachers said it showed 9 because there were 9 shapes. One tried to fit the pieces on top of each other in her mind’s eye and said
“If the square is 50, then the rectangle must be 25 and each square is about 3, so call it 96!”
It is essential that approximate scale be used in such diagrams, 50 is 5 times bigger than 10, and the little blocks (1s) should fit into the 50 square. Funny really, 50 doesn’t make a square … ha ha!
We need to take stock to ensure that any representations we use are actually proportional and emphasize the increasing multiplicative magnitude of the numbers we are working with. Furthermore, we need to ensure our students think proportionally when creating their diagrams.
Try the activity with your classes, let us know what it reveals. Is place value deeply understood and rock solid? Enjoy the rest of first term.
Cheers,
